Antarctic ice-sheet monitoring from
optical images acquired by Landsat 8 Operational Land Imager (OLI) under
unfavorable lighting conditions and quasi-homogeneous surface properties
Dataset: Ice-Sheet Semantic Segmentation (I3S), references:
[1] Frames Learned by Prime
Convolution Layers in a Deep Learning Framework, IEEE TNNLS, 2020
[2] Glacier change along
West Antarctica's Marie Byrd Land Sector and links to inter-decadal
atmosphere–ocean variability, The cryosphere, 2018.
I.
Monitoring by using DNN convolution features
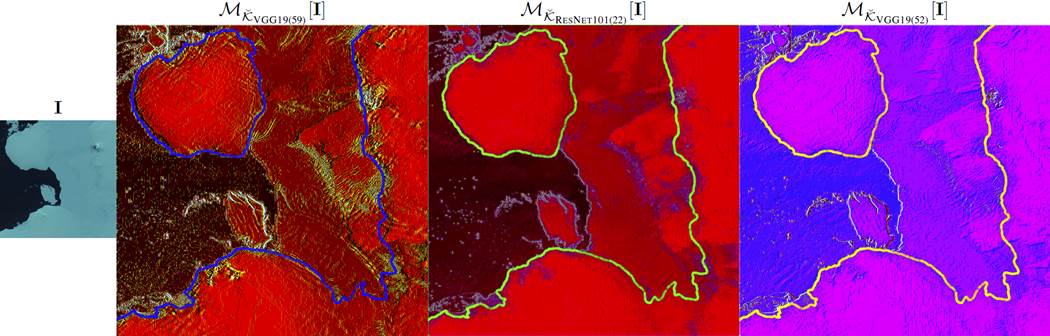
Ice-sheet original image (left) and feature embedding [1] from top 3 convolution kernels: [VGG19(layer 1, kernel 59)], [RESNET101(layer 1, kernel 22)] and [VGG19(layer 1, kernel 52)]. The true grounding lines [2] have been superimposed on the filtering outputs: they are associated with the continuous lines given in blue, green, and yellow colors respectively for the convolution features.
II
Ice-sheet semantic segmentation (inside or outside an emerged an ice-sheet?)
I3S dataset [1] provides training and validation samples (Sites #1 and #3 given on image below), as well as testing samples (Site #2 on image given below).
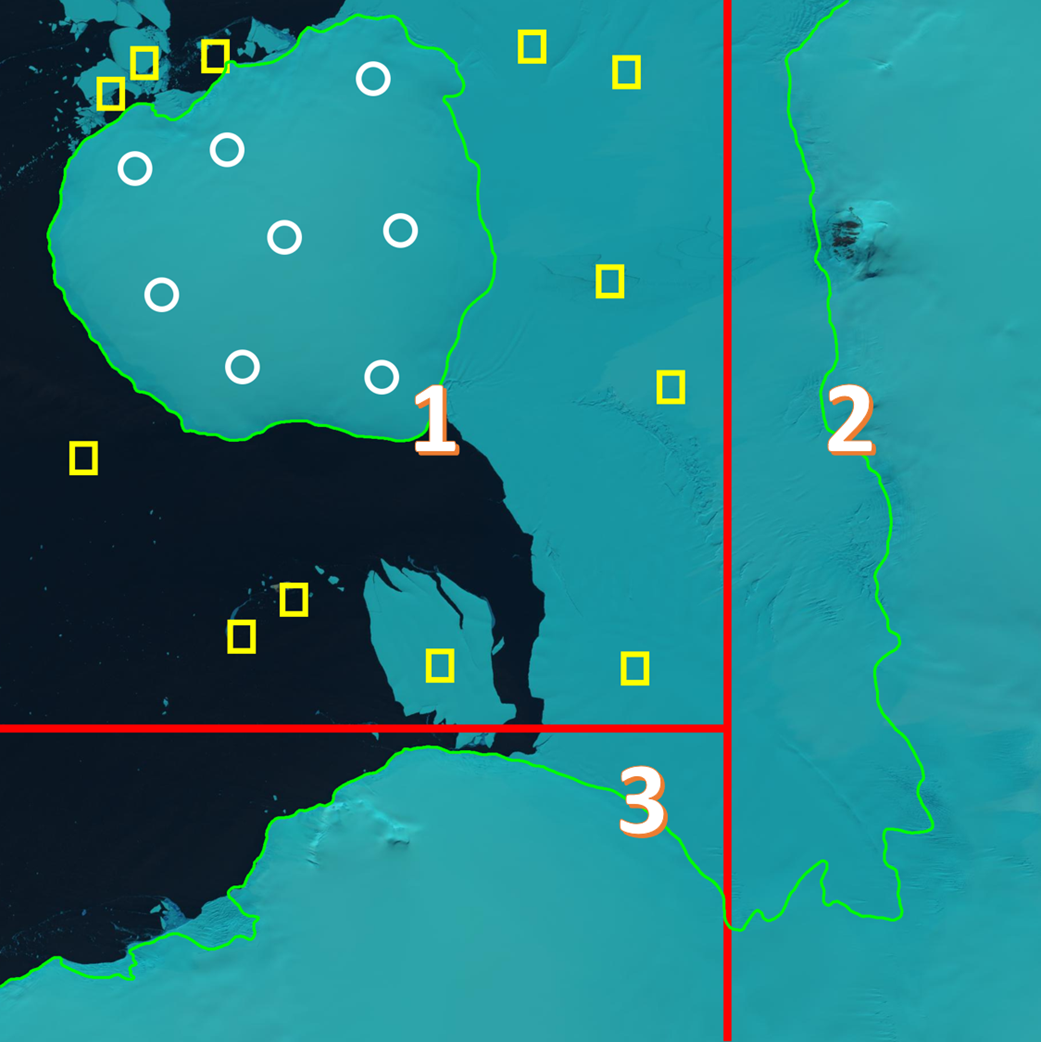
In I3S folder: samples are located either inside an emerged ice-sheet (example of squared areas associated with white circles) or outside emerged an ice-sheet (yellow rectangles are examples of training samples). The bright green curves represent grounding lines (borders delimiting emerged ice-sheet).
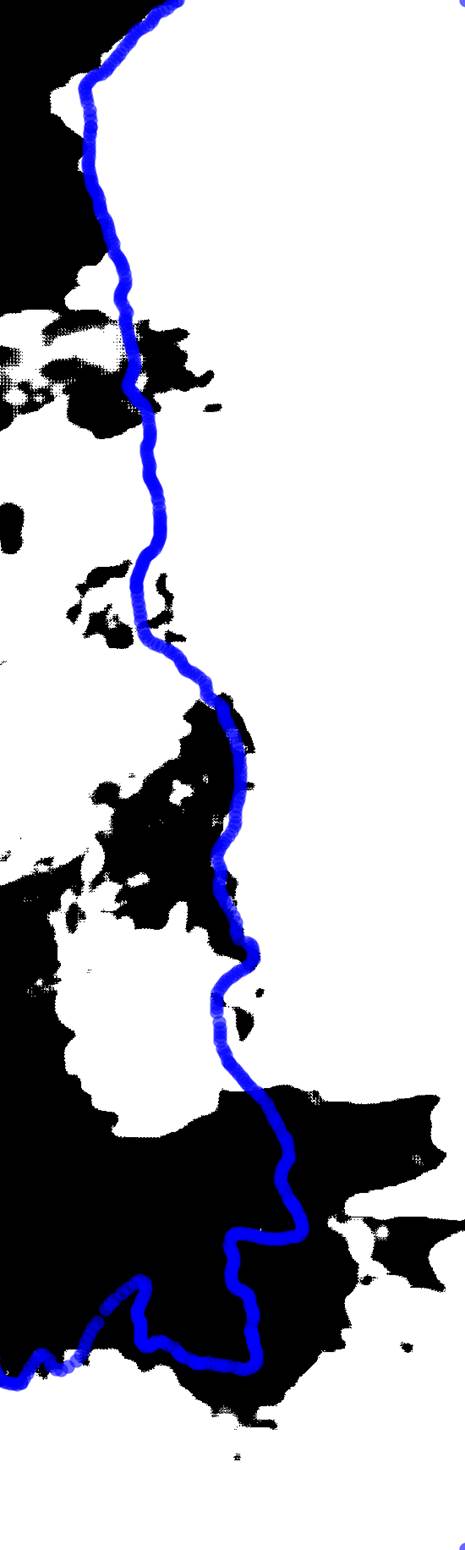
Semantic segmentation
illustrations:
|
DEEP
CONVOLUTIONAL NEURAL NETWORK [1] |
SOFTMAX CONVOLUTIONAL DENSITY
SEGMENTATION [1] |
|
|
|